6.2 Creating a customized log view
You can customize your log view by choosing between three views:
- Chart
- Map
- Values
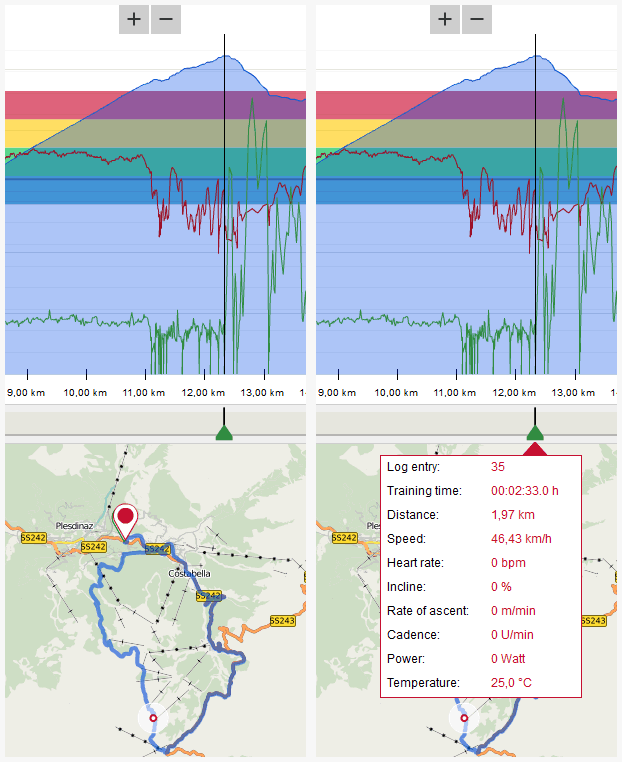
This enables you, for example, to view a graph in the top window and the associated map in the lower section.
If you want to know where the highest point on the map is, drag the green slider to the highest point on the graph. The graph curve can be seen on the map. Use the plus and minus icons to zoom in and out of the map and graph.
You can also view the graph in the upper area and use the green slider to display data at several different points


 Close
Close
