
6.3 Selecting the chart data
You have selected a log and only want to display certain values as lines on the graph. In DATA CENTER, you can show or hide the values, rest periods, and laps plus display average lines and heart rate zones.
Note:
The contents of the chart options adjust to the selected devices and only show information that the device actually provides.
Example:
You have completed a hill training session on your road bike. Afterwards, you want to compare your heart rate, speed, altitude, and ascent on the graph. The graph should also display your average heart rate and the intensity zones.
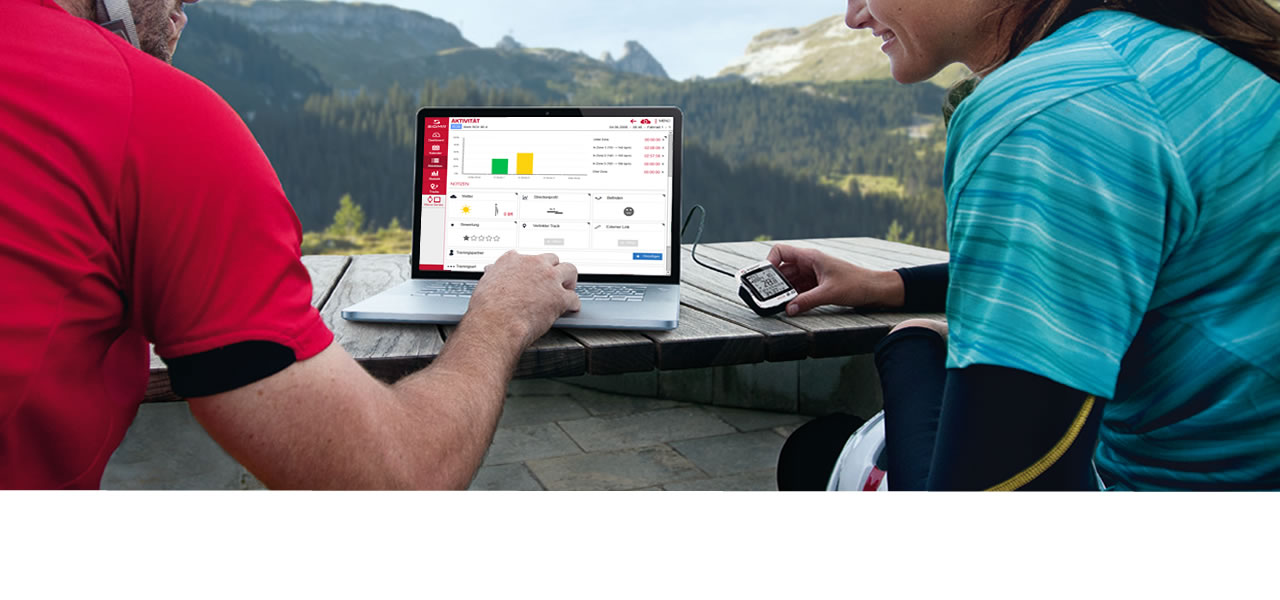
- 1.Click the graph options icon and select the data to be displayed on the graph.
- 2. Click the average icon.
- 3. Select Heart rate.
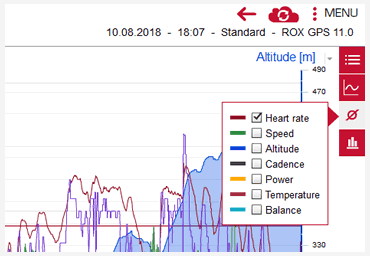
- 4. Select Intensity zones.
- 5. Selected the desired zone. The heart rate zones are displayed in the background of the graph.
Note:
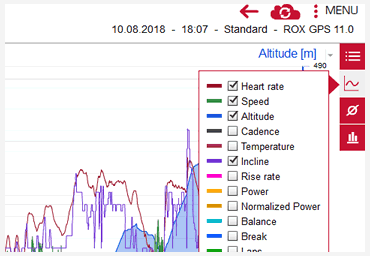
If you have selected a comparison between two different devices, the graph options display all the information provided by both devices


 Close
Close
