
3.1 Statistics in the calendar view
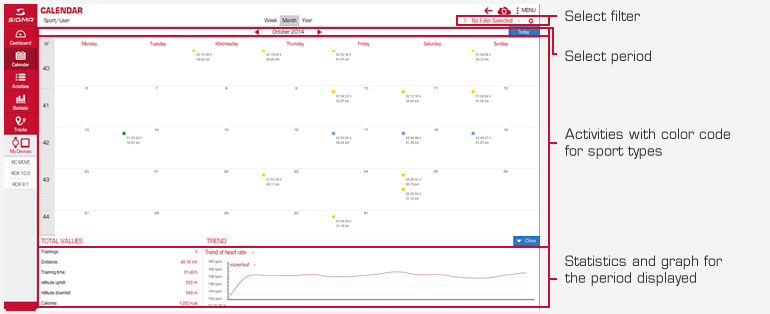
The activities for all sports and users are displayed in the calendar by default. If you have done several activities in one day, you can scroll in the day field.
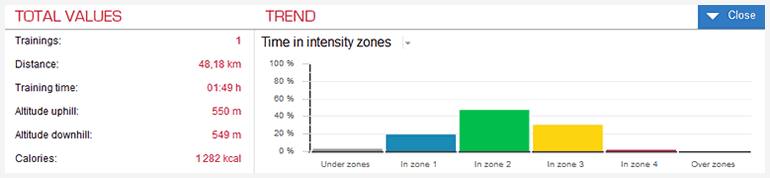
The statistics for the period displayed are shown below the calendar and include the following:
- Activities from the period displayed
- Activities that match the selected filter
The graph shows the progression of the activity and the total values for the period displayed. In the example, the time is displayed in intensity zones. You can view different average values, e.g. the change in average speed or the change in altitude.


 Close
Close
