
6 Activities Log
Some SIGMA devices also record logs. Logs enable you to view and analyze your performances in great detail. The graph and the option of showing and hiding individual parameters assist you with this. Logs can be exported, compared, and edited in other applications.
Note
For clarity purposes, the examples refer to devices in the ROX series or wearables. The values shown cannot be recorded by all devices.
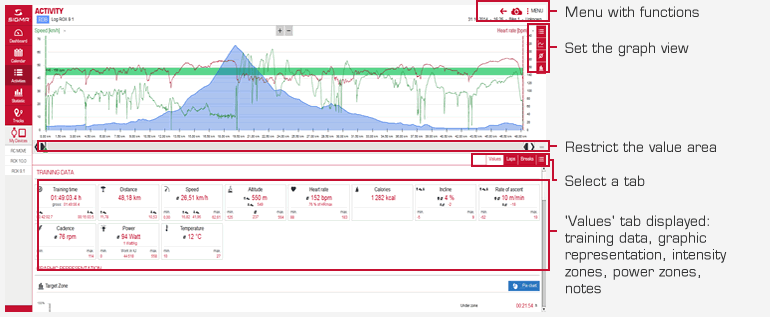
6.1 Log interface
6.2 Creating a customized log view
You can customize your log view by choosing between three views:
- Chart
- Map
- Values
This enables you, for example, to view a graph in the top window and the associated map in the lower section.
If you want to know where the highest point on the map is, drag the green slider to the highest point on the graph. The graph curve can be seen on the map. Use the plus and minus icons to zoom in and out of the map and graph.
You can also view the graph in the upper area and use the green slider to display data at several different points
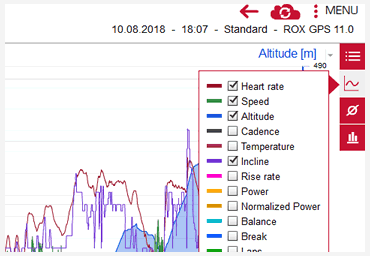
6.3 Selecting the chart data
You have selected a log and only want to display certain values as lines on the graph. In DATA CENTER, you can show or hide the values, rest periods, and laps plus display average lines and heart rate zones.
Note:
The contents of the chart options adjust to the selected devices and only show information that the device actually provides.
Example:
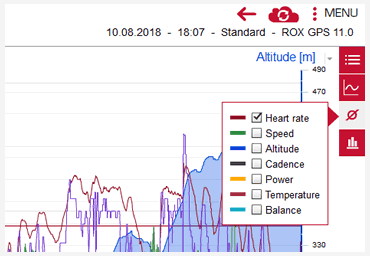
You have completed a hill training session on your road bike. Afterwards, you want to compare your heart rate, speed, altitude, and ascent on the graph. The graph should also display your average heart rate and the intensity zones.
- 1.Click the graph options icon and select the data to be displayed on the graph.
- 2. Click the average icon.
- 3. Select Heart rate.
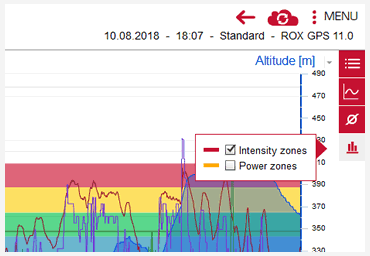
- 4. Select Intensity zones.
- 5. Selected the desired zone. The heart rate zones are displayed in the background of the graph.
Note:
If you have selected a comparison between two different devices, the graph options display all the information provided by both devices
6.4 Data export: exporting a log
You can export individual logs in various file formats for data exchange purposes.
| File format | Exported | Reason |
|---|---|---|
| smf | Data and notes |
|
| slf | Individual values, laps, breaks, and notes |
|
| csv | Individual values |
|
| fit | Individual values and laps |
|
Example:
You have completed a training session with a teammate and have both recorded logs of the activity. You now want to compare the data. You therefore export the log as an slf file.
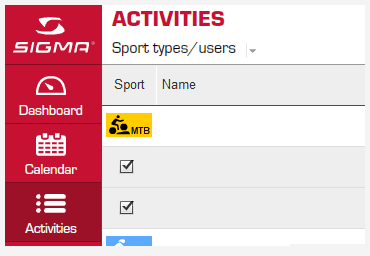
- 1. Click the sport type icon for the log. The icon turns into a check mark.
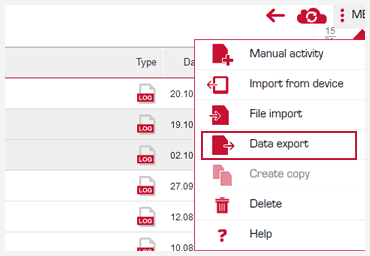
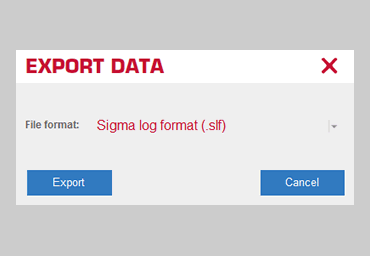
- 2. Select Menu followed by Data export. The File window opens.
- 3. Wählen Sie als Dateityp "slf" aus und dann Exportieren.
- 4. Select the File type "slf" followed by Export.
- 5. Enter a meaningful name in the File name field.
- 6. Click Save. The log is exported with all the data.
Tip - Multi-export
You can also select multiple logs for export.
6.5 Generating a track from a log (ROX 10.0 GPS)
You can use logs recorded on a ROX 10.0 GPS or above to create tracks in DATA CENTER.
Example:
You have created a LOG during a bike race and want to ride the route again at a later date.
Prerequisite:
The log is stored in DATA CENTER.
- Select the log from the activities list. The log is displayed.
- Select Menu followed by Save as track.
- Give the track a name.
- Save the track. The track is available in DATA CENTER.
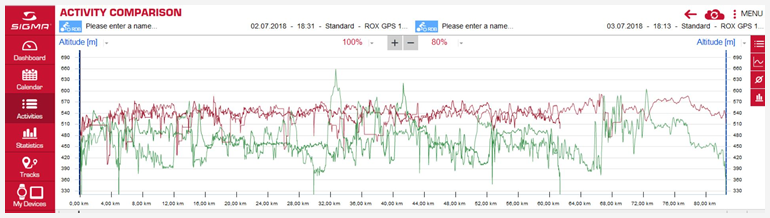
6.6 Comparing logs
You can compare either two of your own logs or one of your own logs and an imported log from a teammate.
Example
You have completed a hill training session with a teammate and have both recorded logs of the ascent. You now want to compare the heart rate values. You have already imported your log into DATA CENTER. You have received a log export from your teammate and imported it into DATA CENTER.
- Open a log.
- Select Menu followed by Comparison. A window with the available logs opens.
- Select a log. The two logs are now evaluated one above the other or next to each other.
- Select Heart rate in the graph options.
Tip:
By changing the percentage values, you can set which graph is more greatly emphasized or hidden.
6.7 Unit of the X axis
Specify whether the time or distance is displayed on the x-axis.
- Select Menu followed by Unit of the X axis. The unit is changed.
6.8 Speed format
You can choose whether to view the speed in km/h or the pace in min/km.
- Select Menu followed by Speed format. The format changes.
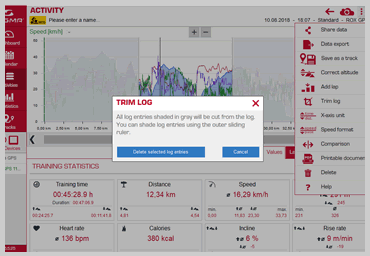
6.9 Trim log
You can also analyze parts of a log in the log view. The delimitation also changes the values displayed in the lower area of the window. These values only relate to the restricted area. You can also trim the log to delete unimportant sections of an activity. Only the data in the delimited value area is saved in the log.
Example:
You only want to analyze a specific section by trimming the log.
- Open the log.
- Drag the left-hand, black slider arrow to the start of the section.
- Drag the right-hand slider arrow to the end of the section. Parts of the graph are now grayed out.
All the data in the tabs displayed below the graph now relate to the non-grayed-out area between the two slider arrows. - Select Menu. The available functions are displayed.
- Select Trim log. An information window opens.
- Select Trim marked log entries. The grayed-out areas in the graph are deleted. The log now only contains data from the selected section.
Tip:
Use the zoom slider (+ -) to zoom in and out of the graph.
6.10 Altitude correction
If you did not have the opportunity to calibrate your SIGMA device, you can retrospectively correct the start altitude.
- Select Menu followed by Altitude correction. The Adjust altitude window opens.
- Enter the base altitude then click Adjust altitude. The graph is adjusted accordingly.
6.11 Add lap
The Add laps function enables you to retrospectively divide a log into sections. The sections are described as laps and the values for these are displayed in a table.
Example:
Your activity comprises three phases and you want to use the log recorded to calculate the values for the individual phases.
- Select Laps in the graph options. The laps are displayed (L plus number).
- Drag the green slider arrow to the point at which the first lap ended.
- Select Menu followed by Add lap. A new lap is created in the Laps tab and the values are calculated from the start of the log up to the lap point. A green L appears on the graph.
- Drag the green slider arrow to the end of the second phase and add the second lap.
- Drag the green slider arrow to the end of the graph and add the third lap.
6.12 Edit lap
- Select Laps in the graph options. The laps are displayed (L plus number).
- Select a lap. The lap data is displayed.
- Click the Edit icon and enter the information.
- Click Save.
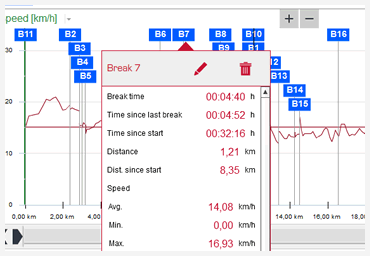
6.13 Editing a break
Example:
You want to add more information about a break, the log is already open, and the breaks are displayed (B plus number).
- Select a break. The data since the start is displayed.
- Click the Edit icon and enter the information.
- Click Save.
6.14 Entering notes
In addition to the pure performance data for an activity, you can also enter information about the weather, the profile, or the intensity.
Example:
You want to enter notes about your most recent activity. DATA CENTER is active, you have imported the activity and the dashboard is open.
- Select the most recent activity. The activity data is displayed.
- Scroll in the Notes area.
- Enter your notes. The notes are automatically saved when you close the window.
Tip
If you want to enter notes about an older activity, open the activity by going to Activities > Activity.
How to use the Notes area
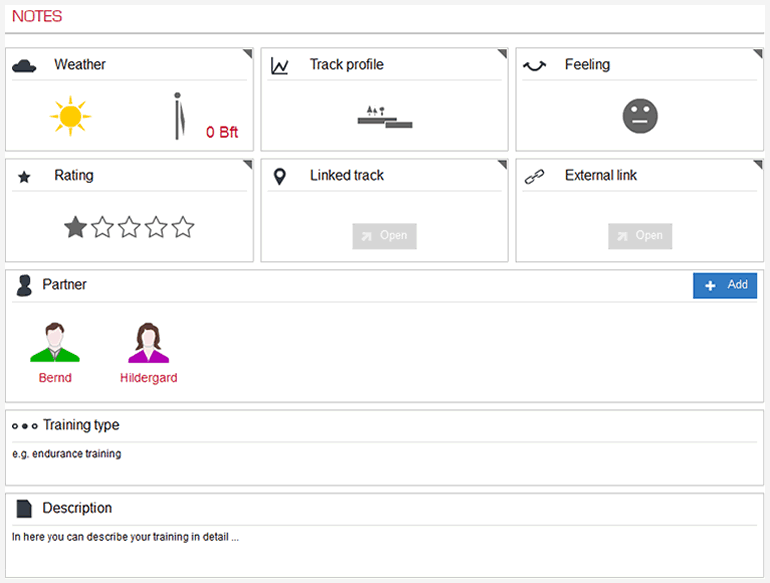
Enter a description
Enter text describing the training session or anything in particular that occurred.
Add a training partner/group
Click the plus sign in the training partner area to add a new training partner. The new training partner is saved and can be selected in future notes. You can also add and select a training group.
Delete a training partner
Select a training partner to delete his/her assignment to an activity (recycle bin).
Enter training type
Enter training type.
Weather, trip distance profile, and rating
Click the applicable area to view the available options. Select the appropriate rating. For devices that do not record the temperature, you can also enter the temperature.
External link
Add a link to photos of the activity online or a film of your descent, for example.
Linked track
You have stored a track in DATA CENTER that is suitable for the activity. Select it to add it to the notes.
6.15 Transferring a ghost race (ROX 9.1, BC 23.16)
To use the ROX 9.1’s ghost race function, transfer a recorded log back to the ROX 9.1.
Tip
If you want to ride against a training partner’s log, first import his/her log and then transfer this to your ROX 9.1 as the ghost race.
- Use the docking station to connect your ROX 9.1 to DATA CENTER.
- Switch to the activities list. All activities are displayed.
- Select the log. The log is displayed
Note
The log for a ghost race can be no longer than 5 hours.
- Select Menu followed by Transfer ghost race.
- Enter a name for the ghost race. The log is then stored on the connected ROX 9.1.


 Close
Close
